Subscription Analytics
Fiber customers carry 68.7% of lost billing, and price is not why they leave.
Public dataset; the pipeline, the analysis and both dashboards are mine.
01 · The finding
Fiber customers carry 68.7% of lost billing, and price is not why they leave.
More than two of every three dollars of monthly billing lost to churn this quarter left with one kind of customer: fiber broadband on a month-to-month contract. They churn at over twice the DSL rate on the same contract, at the same age, from their first month — and even at the same monthly bill.
The decision this implies: do not answer fiber churn with discounts. Compared at the same price, fiber churns 34 to 37 points more than DSL, and within fiber churn falls as the bill rises. Fiber churners name a competitor more often than DSL churners do and name price no more often. The work is to find out what competitors are offering fiber customers that this operator is not.
02 · The question
I asked where the churn comes from, and whether price explains it.
- Scope
- 7,043 customers, 1,869 of whom left. Analysis covers the 5,992 past their first three months.
- Window
- One quarter, cross-sectional. No trend can be measured from it.
- Data
- Public telecom customer book, entirely in California.
- Method
- dbt models on BigQuery; Mantel-Haenszel pooled comparisons, direct standardisation, Kitagawa decomposition and likelihood-ratio interaction tests in Python.
03 · What the data showed
Age, product and contract each narrow the problem to one segment.
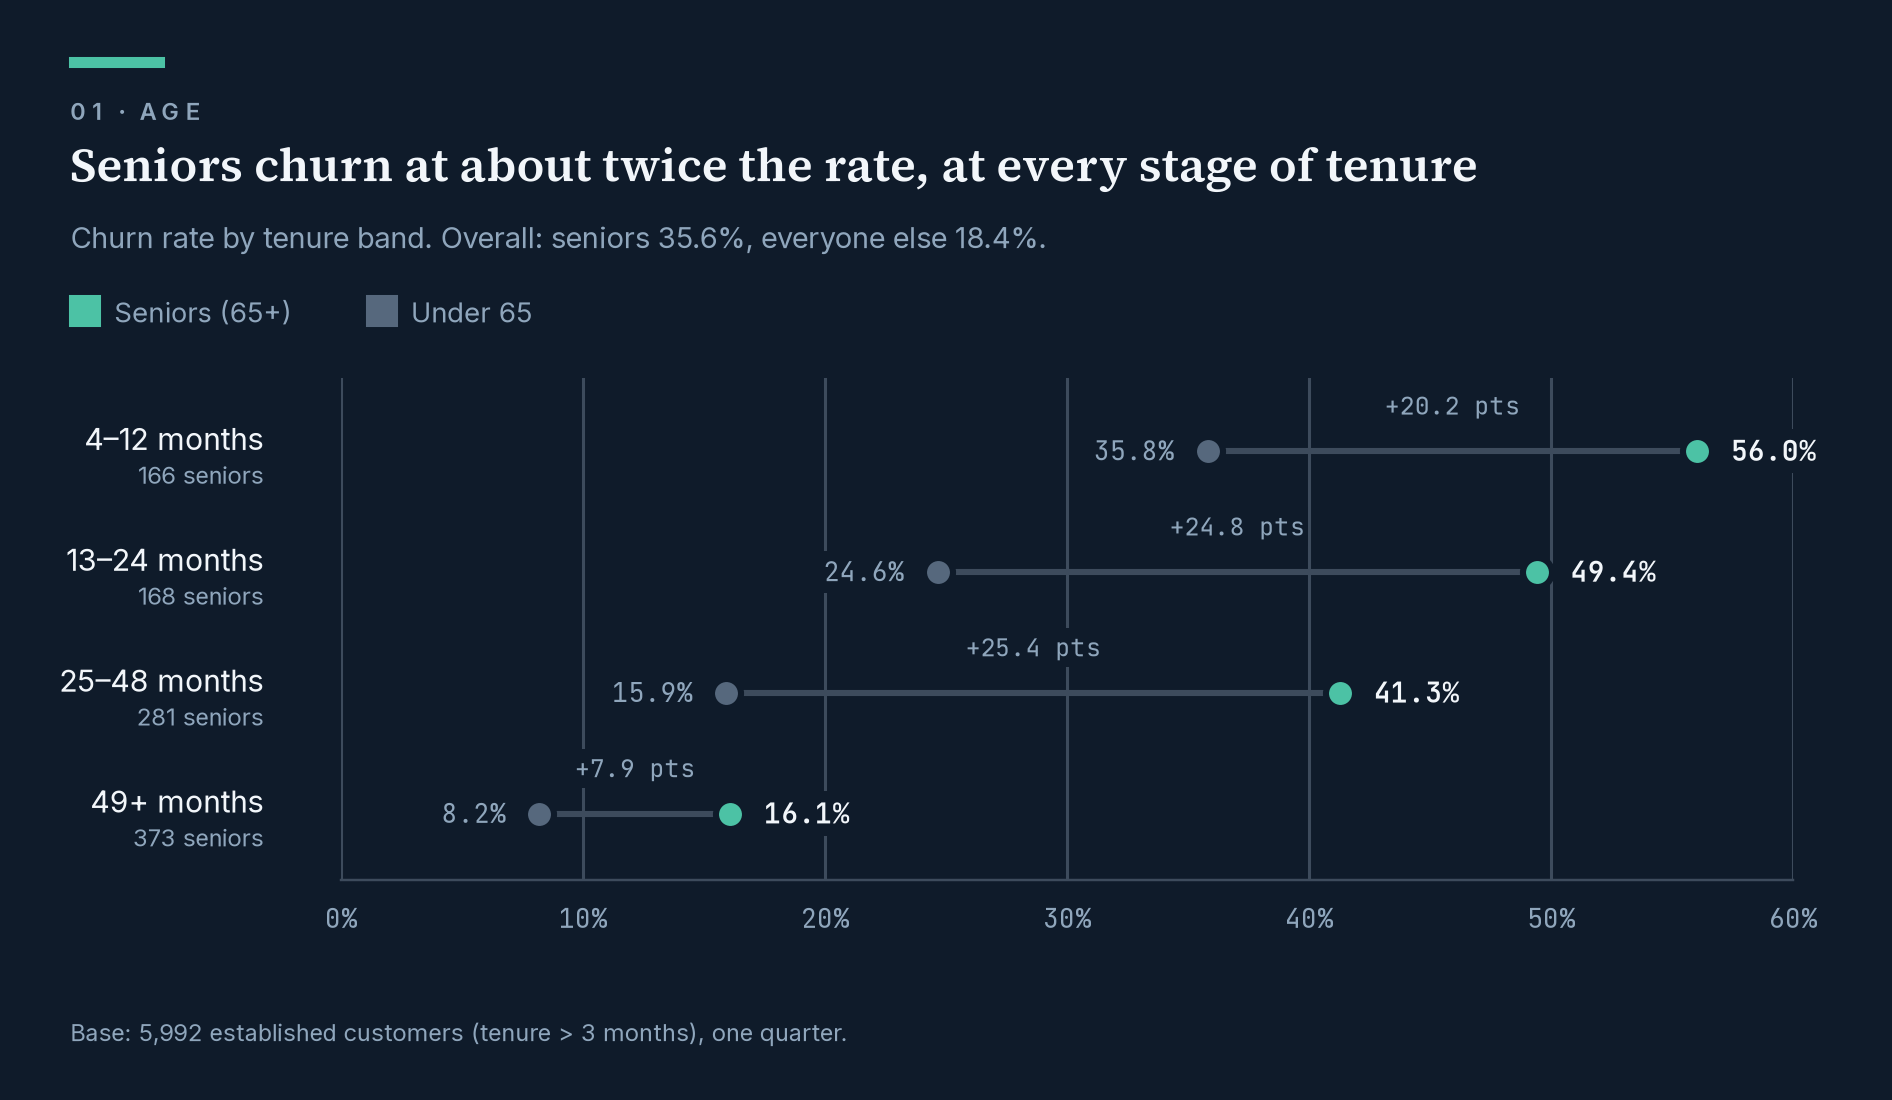
Seniors churn at about twice the rate, at every stage of tenure.
Seniors churn at 35.6% against 18.4% for everyone else — 1.94 times the rate. The gap holds in every tenure band, from +20.2 points in the first year to +7.9 points past four years, so tenure is not what makes the difference: standardised to a common tenure mix the gap is still 17.8 points (95% CI 14.7-20.8). Seven in ten seniors are on fiber, which leads straight into the next cut. Base: 5,992 established customers.
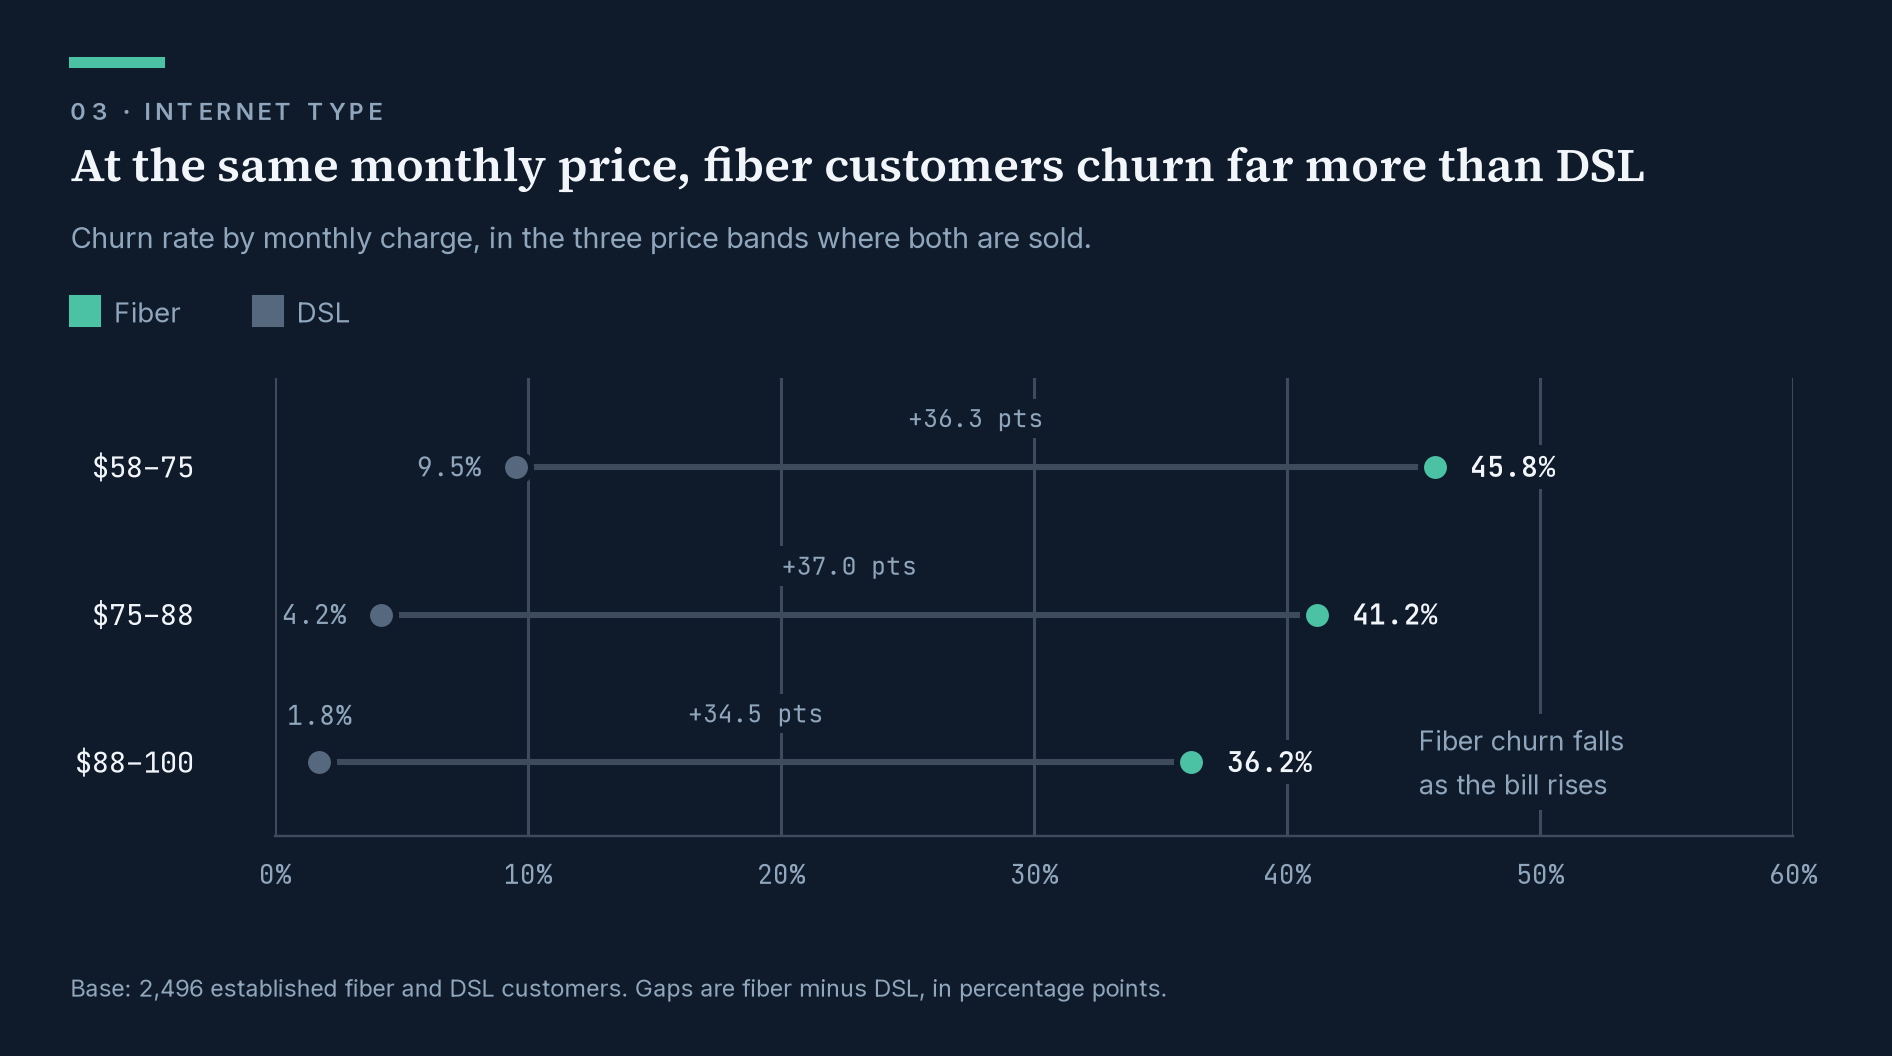
At the same monthly price, fiber customers churn far more than DSL.
Fiber is the premium product, so price was the obvious explanation and I expected the gap to shrink once customers were compared at the same monthly bill. It widened instead — 34 to 37 points in all three bands where both products are sold — and within fiber, churn falls as the bill rises. That one check turned the recommendation away from discounts. Base: 2,496 established fiber and DSL customers.
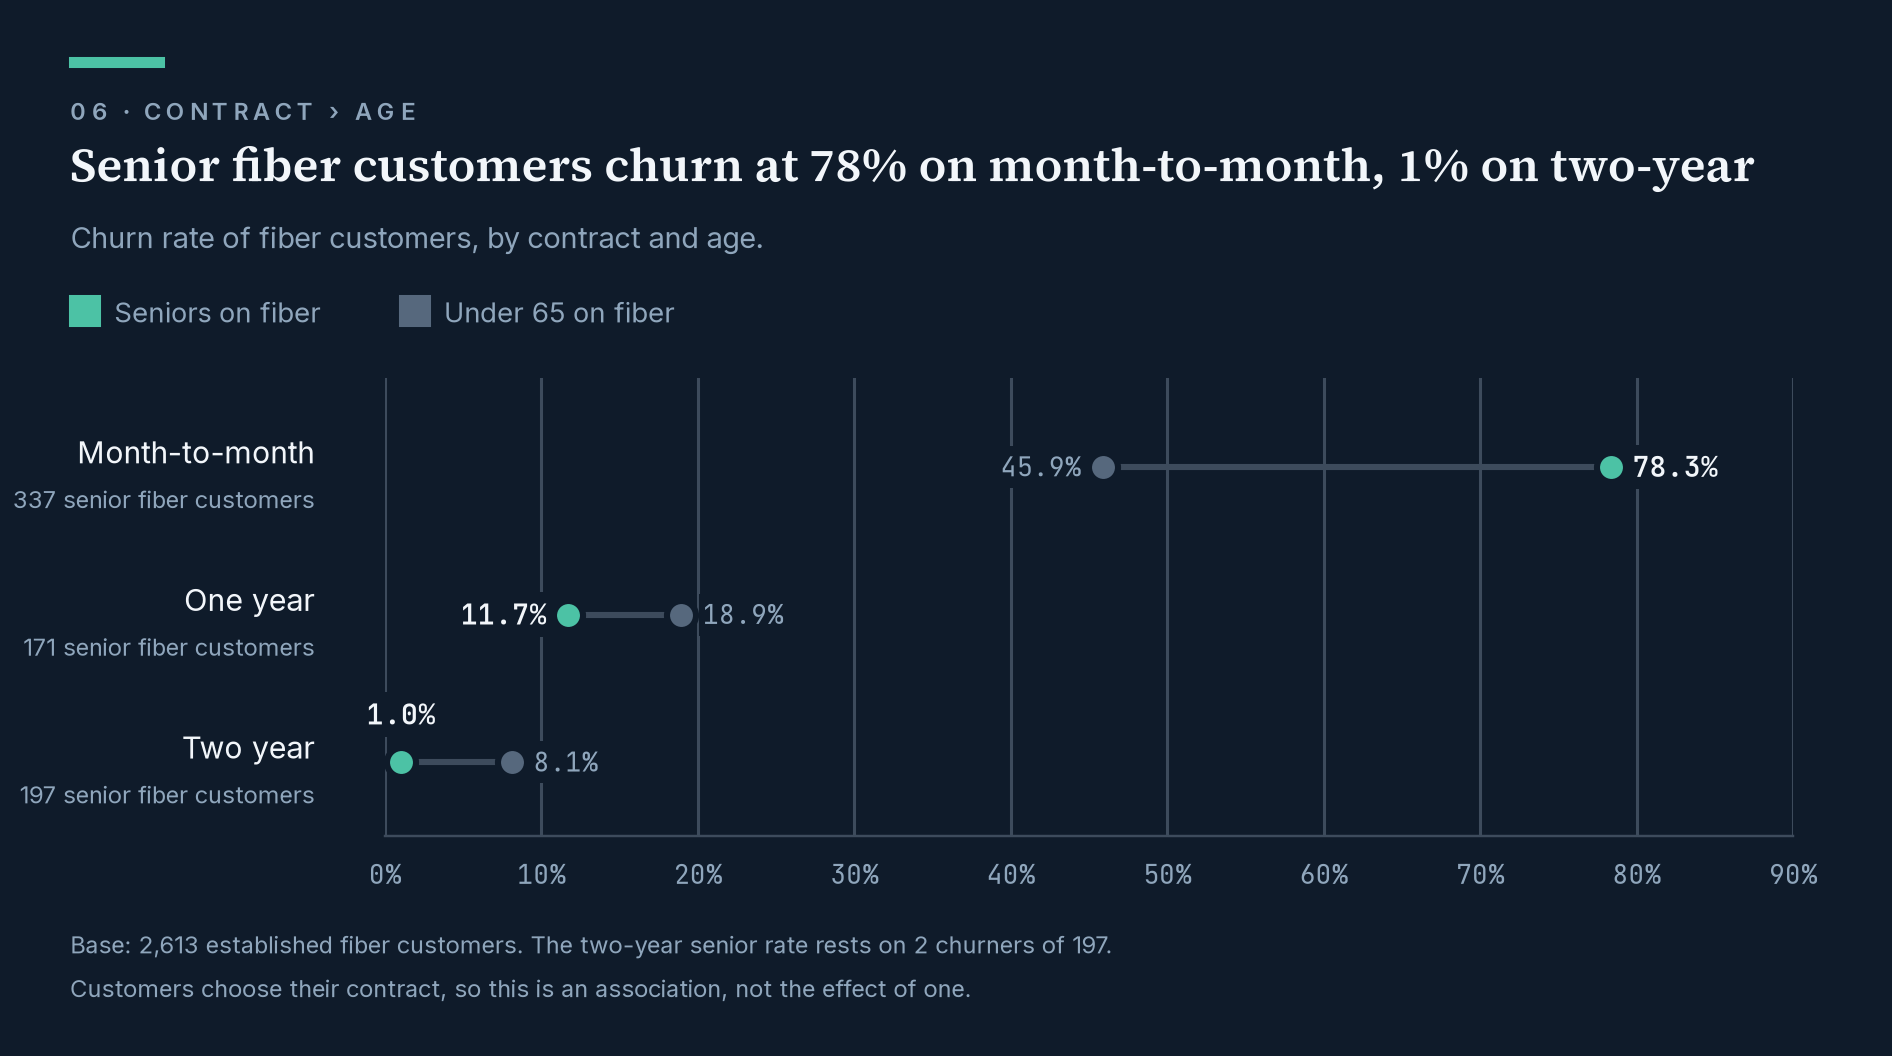
Senior fiber customers churn at 78.3% on month-to-month and 1.0% on two-year.
The senior effect appears only on month-to-month contracts; on committed contracts it disappears. The 337 senior fiber customers on month-to-month are 5.6% of the established book and 20.8% of its churn. The two-year figure rests on 2 churners out of 197, and customers choose their own contract — so this marks where a lever might be, not that pulling it works. Base: 2,613 established fiber customers.
04 · What it costs
Fiber-specific churn costs about $37,000 a month.
The month-to-month fiber customers who churned were billing $95,594 a month between them, 68.7% of the $139,131 lost across the whole book. Not all of that is recoverable, because month-to-month DSL customers churn too. Had the 1,475 established month-to-month fiber customers churned at the DSL rate, about 425 fewer would have left (358-487) — about $37,400 a month, with a 95% range of $31,500 to $42,900, or roughly $450,000 over twelve months ($380,000-$515,000). The monthly figures are actual billing; the twelve-month horizon is an assumption about how long those customers would otherwise have stayed, not a measurement.
05 · What I recommend
Three changes follow, and each one is a test rather than a rollout.
Do not answer fiber churn with blanket discounts. At the same price fiber churns 34 to 37 points more than DSL, within fiber churn falls as the bill rises, and fiber churners cite price no more often than DSL churners. If a discount is tried anyway, run it head-to-head against a non-price offer so the comparison is fair.
Head of Marketing · 7 October 2026
Pull the competitor named and the offer described from cancellation records or retention-call notes, then pilot the most likely response against a control group. The reason codes say who customers left for; they do not say what the competitor offered.
Head of Strategic Research · 1 October 2026
Test a one-year contract offer on month-to-month fiber accounts with a holdout group, starting with senior fiber customers. Make the offer to a random half, hold back the other half, and compare 90-day churn. The incentive has to cost less than what it keeps: the average bill in this segment is $89.90 a month.
Head of Data and Analytics · 12 October 2026
06 · Method and caveats
The method is observational, and it establishes association rather than cause.
The analysis is specified as follows.
- Staging and mart layers in dbt on BigQuery, a star schema for self-serve slicing and a pre-computed exhibit layer so the dashboards match the written story to the decimal.
- 31 automated tests, including a story-parity check that fires the moment published numbers drift from the story's.
- Wilson intervals on rates and Newcombe intervals on differences, implemented identically in SQL macros and in Python so the two agree.
- Mantel-Haenszel pooled comparisons, direct standardisation, Kitagawa decomposition, Breslow-Day and likelihood-ratio tests for interaction.
- Delivered three ways for three audiences: a written data story, a Tableau story for a presented readout, and a Power BI dashboard for analysts returning with their own questions.
These hypotheses were tested and rejected.
- Price was the obvious explanation for the fiber gap and was tested first. Compared at the same monthly bill the gap widened rather than narrowed, which turned the recommendation away from discounts.
- Paperless billing looked like a driver at 27.7% against 11.7%, but 54% of that gap is internet type, and among customers with no internet it disappears entirely. It marks the fiber customer rather than acting as a lever.
- Cities are too small to rank: 1,105 of them, median 4 customers each.
These limits apply.
- One quarter, cross-sectional. Trends, seasonality and compounding cannot be measured from it.
- Customers choose their contract and their product, so differences between groups may reflect who chooses rather than what the choice does. That is why every recommendation is a test with a holdout rather than a rollout.
- The two-year senior fiber rate of 1.0% rests on 2 churners out of 197.
- Cancellation reasons are codes from a fixed list, not customers' own words, and they exist only for customers who left.
- The source data marks 'no internet' with the text 'none' rather than a null. Standard null handling silently dropped 1,274 customers from an analysis until I traced it.